Purpose: 1) To determine the acceleration of gravity for a freely falling object. 2) To gain experience using the computer as a data collector.
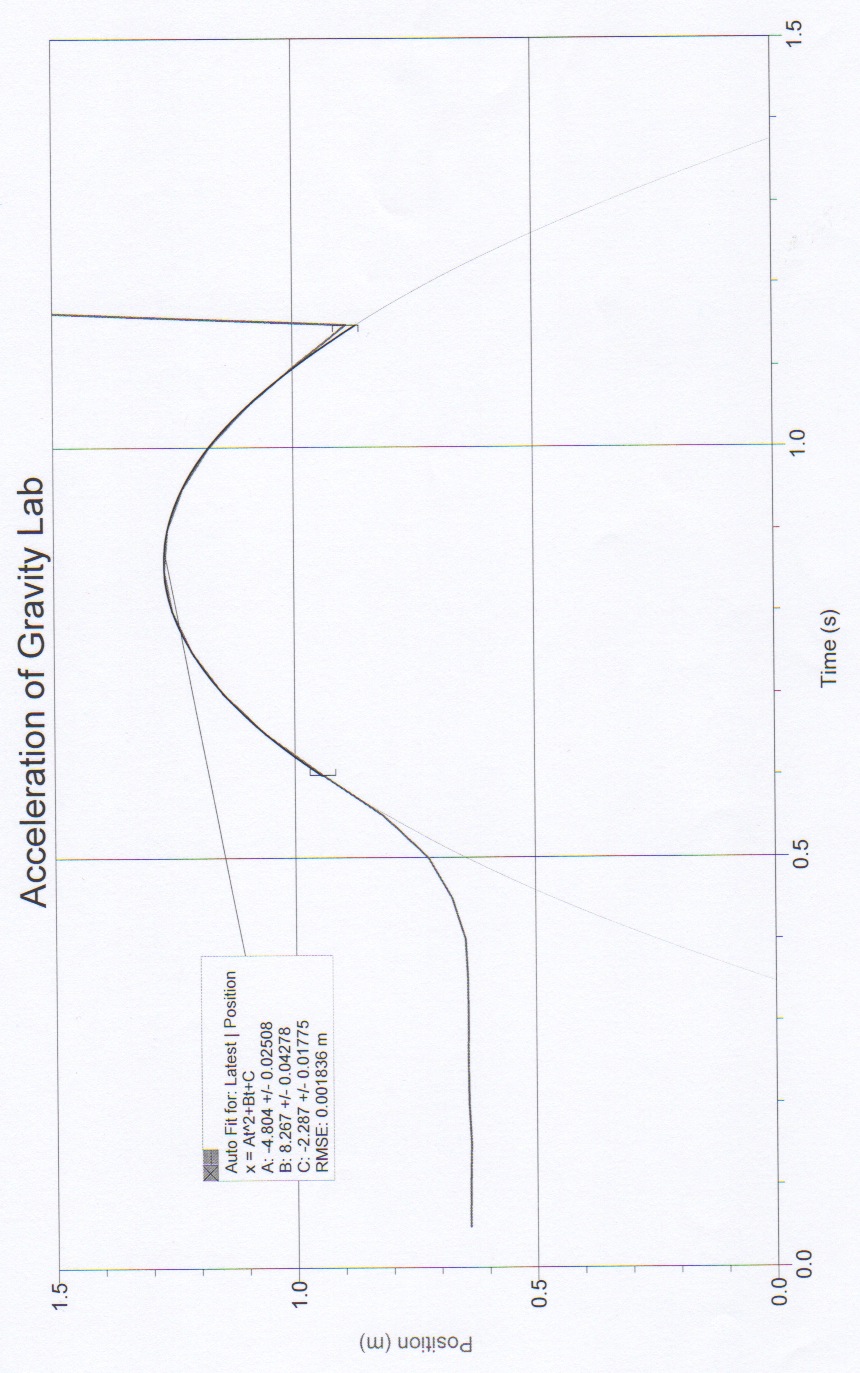
We had to throw a ball up over the motion detector to get a position verses time graph. We were supposed to get a parabola for the path of the ball, like we did. The reason it should be a parabola is because the ball will go up and then at some point come down.
Also on this graph is the best fit line. This line shows the closest equation for a parabola. This parabola is a good example because it is almost half of gravity, 9.8 m/s/s, at 4.8 m/s.
This graph is velocity verses time. This graph is a straight line because it takes the slope of the position verses time graph which is linear. The best fit line is also there. This line is a little under what gravity really is. The slope of this line is 9.1 m/s/s.
The slope of this graph is negative because the parabola of the position verses time graph is negative. That is negative because the ball went up and then down. Since the slope of this line is the slope of the parabola the slope has to be negative.
| Trial |
gexp (2a) (m/s/s) |
% difference |
gexp (m) (m/s/s) |
% difference |
| 1 |
9.608 |
1.96 |
9.13 |
6.84 |
| 2 |
9.462 |
3.45 |
9.259 |
2.97 |
| 3 |
9.524 |
2.82 |
9.416 |
3.92 |
| 4 |
9.634 |
1.7 |
9.613 |
1.91 |
| 5 |
9.586 |
2.18 |
9.74 |
0.61 |
This table shows five different ball drops. For each trial we took double the velocity to see how close it is to gravity. The percent difference shows the difference between what we got and what gravity really is. Then we took the slope of acceleration to see how close to gravity it is. The percent difference show the difference between gravity and the slope that we got.
This is the motion diagram we made for position verses time. We labeled the origin and the positive direction. Also, we showed the direction of acceleration. Where the purple arrow is, it shouldn't say a=0, it should say v=0. On the left side it shows that the ball is decreasing in motion in the positive direction. On the right side, the ball is moving in the negative direction and is increasing. The point where there is a break in the motion diagram connected by the pink doted line is where v=0 because there is the point where the ball begins its dissension.
In this lab we found the velocity and acceleration from the path of a ball being tossed in the air. With those we found the difference in what we found and what is actual. Nothing was perfect, because a ball thrown by a person can not be a perfect parabola. That is why we did more than one trial so that we can get as close to perfect as possible. For all of the velocity, the differences were less than four percent. However, over all the difference for acceleration beat velocity except for one trial. Trials 2-5 were all less than four percent as well. The first trial was less than seven percent. Trial five for acceleration was less than one percent leaving it to be the best over all.


Hi Raychel,
ReplyDeleteThanks for this very nice lab writeup. Please more discussion of errors in future reports; also sample calculations please.
I like your inclusion of a motion diagram -- it completes the explanation.
grade == s