Thursday, December 13, 2012

Hooke's Law and the Simple Harmonic Motion of a Spring

Purpose: To determine the force of a spring and to study the motion of a spring and mass when vibrating under influence of gravity.

2. Make a plot of the downward force applied to the spring verses the displacement of the spring.
Spring vs. Displacement Graph

3. Create a table with data.
Data Table

Graph for m = 1050g
Conclusion: This lab was very difficult. We were supposed to use Hook's Law for this lab. I learned that the force and the displacement are inversely proportional. If one is increasing the other is decreasing. To make this lab better, it would be good to have learned Hook's Law first and then tried the lab. Some sources of error would be that the masses on the spring would get too close to the motion detector so it wouldn't read all of it.


Wednesday, December 12, 2012

The Ballistic Pendulum

Purpose: To use the ballistic pendulum to determine the initial velocity of a projectile using conservation of momentum and conservation of energy.
Part 1:
Ball shot into cylinder data

 5. From these data calculate the initial velocity v using equations V = (2gh)^1/2 and mv = (M+m)V.
mv = (M+m)(2gh)^1/2
v = [(M+m)(2gh)^1/2]/m
v = [(.1994+.0573)(2*9.8*.096)^.5]/.0573
v = 6.145 m/s

Part 2:
Ball shot not into cylinder data
2. From the values of deltaX and deltaY calculate Vo by the use of equations deltaX = Vox*t + .5ax*t^2 and deltaY = Voy*t + .5ay*t^2.
deltaX = 2.7319 and deltaY = -1.006
Vox = deltaX/(deltaY/-4.9)^.5
Vox = 2.7319/(-1.006/-4.9)^.5
Vox = 6.029

3. Find the percent difference
[(6.145 - 6.029)/6.029]*100 = 1.92% difference

Conclusion: This lab was to have us find velocity for a projectile object. I learned that it is best to have the same person launch the ball each time. Otherwise it is one more variable that isn't controlled. The error in our lab could have come from having different people launch the ball. To make this lab better we can keep as many things consistent as we can.

Tuesday, December 11, 2012

Inelastic Collisions

Purpose: To analyze the motion of two low friction carts during an inelastic collision and verify that the law of conservation of liner momentum is obeyed.

Mass bar 1: .497 kg
Mass bar 2: .495 kg
Cart 1: .501 kg
Cart 2: .517 kg

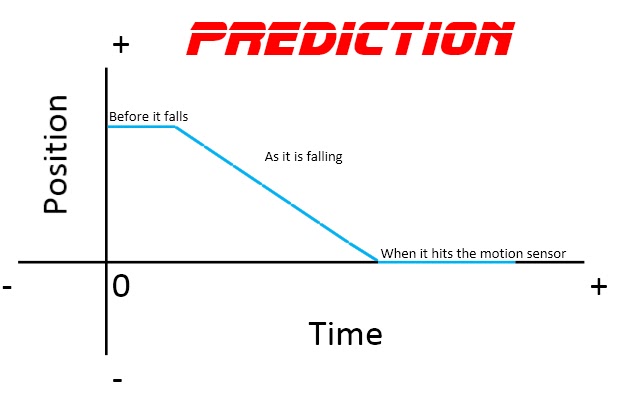
2. Does it provide a reasonable graph of the motion of the cart?
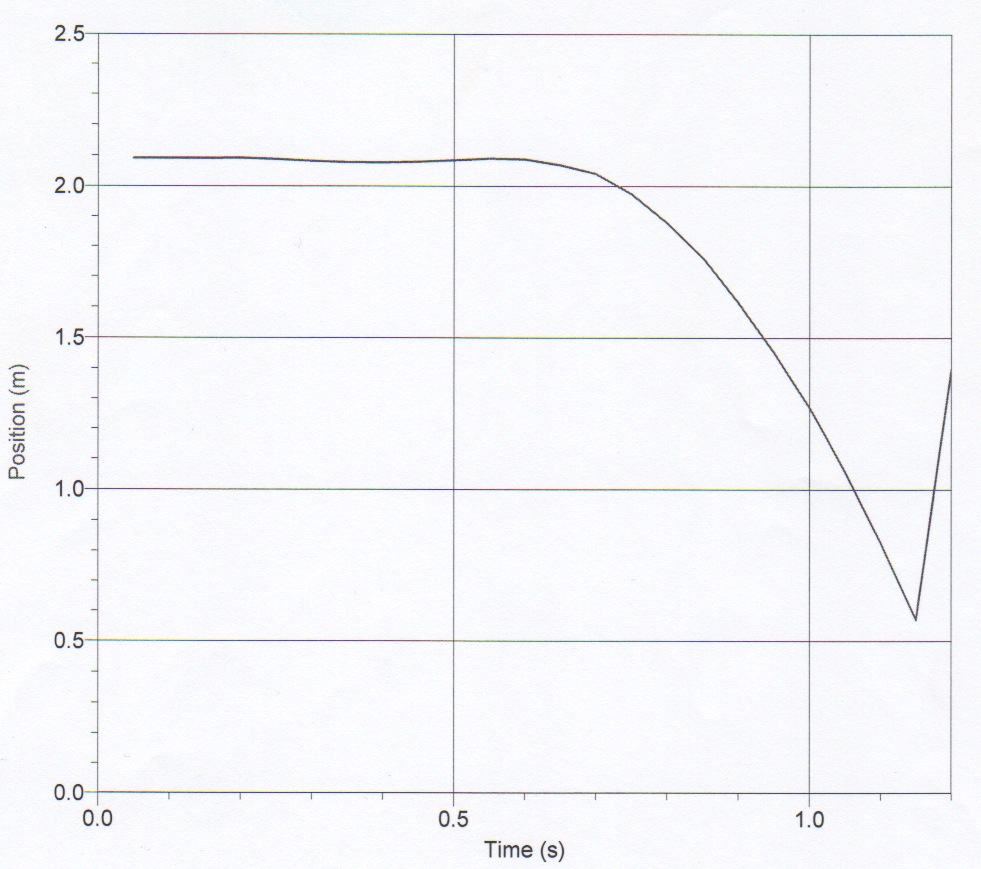
- The graph showed a reasonable graph for the motion of the cart closest to the detector and then again when the carts collided and stuck.

3. What should these graphs look like?
- The graphs of position vs. time should be increasing throughout the whole graph. At the point of collision, the slope is small that before the collision.

- It is a good approximation to get the velocity right before and after the collision if momentum is conserved. P of C1 proportional to P of C1 + C2.

Trials with different mass
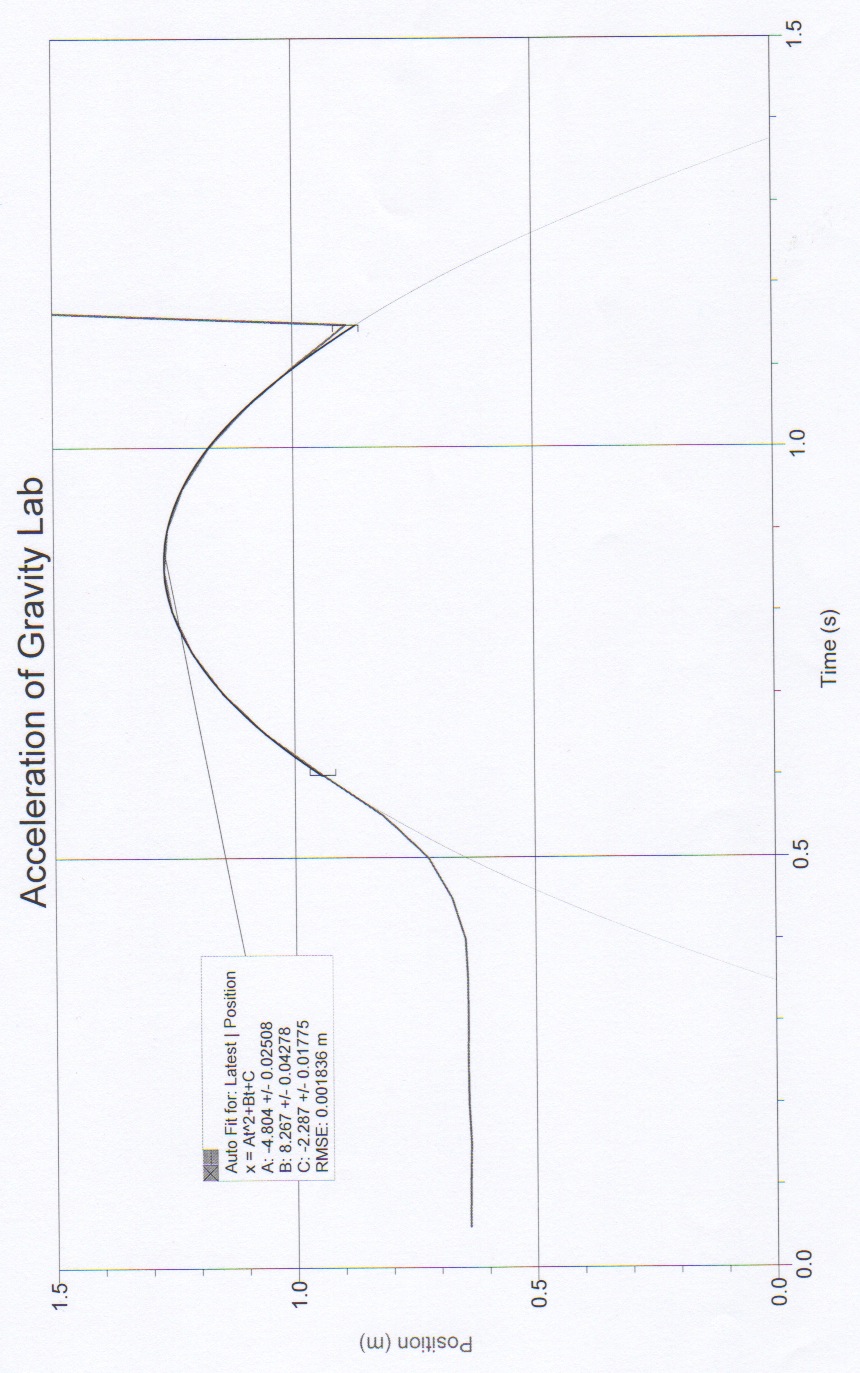
5. The velocity vs. time graph is all constants at different values during certain time intervals. The acceleration vs. time graph is a constant zero for the entire graph.

7. For most of the trials we got around 20% difference. There was a few that we were about to get around 10% difference. In the final set of trials, we got one trail around 6% and another at just under 4%. The law was obeyed fairly well. We could have done better. However, there are sources of error to take into account.

Kinetic energy lost

8. Kinetic energy = .5mv^2


9a) A mass, m, colliding with an identical mass, m, initially at rest.
deltaK/Ki = (Kf-Ki)/Ki = Kf/Ki - 1

9b) A mass, 2m, colliding with a mass, m, initially at rest.
 deltaK/Ki = (Kf-Ki)/Ki = Kf/Ki - 1 
Kf/Ki - 1  = .5(2m)Vf^2/.5mVi - 1 = 2Vf^2/Vi - 1
Vf = Vi/2
2Vf^2/Vi - 1 = 2(Vi/2)/Vi - 1 = -.5

9c) A mass, m, colliding with a mass, 2m, initially at rest.
deltaK/Ki = (Kf-Ki)/Ki = Kf/Ki - 1 
Kf/Ki - 1  = .5(m)Vf^2/.5(2m)Vi - 1 = Vf^2/2Vi - 1
Vf = Vi/2
Vf^2/2Vi - 1 = (Vi/2)/2Vi -1 = -.75

Conclusion: In this lab we learned about inelastic collisions and conservation of momentum. I learned about the kinetic energy and how to find the loss of kinetic energy when there is a collision. One source of error would be friction. We did not take into account the friction on the track. Also, depending on where the war was in relation to the motion detector, it may not have read it. The closer the carts get to the motion detector the harder it is to read it. To make this lab better, we would have to do more trials. Also, do all the calculations right after the trials so that we can use the best results.

Thursday, November 29, 2012

Balanced Torques and Center of Gravity

Purpose: To investigate the conditions for rotational equilibrium of a rigid bar and to determine the center of gravity of a system of masses.

Clamp 1: .02305 kg
Clamp 2: .0212 kg
Clamp 3: .0195 kg
Clamp 4: .0215 kg
m actual = .1469 kg
Meter stick: .091 kg
Balance point: .486 m
The meter stick balanced
2) C2 + .1 kg at .1 m                  C3 + .15 kg at .762 m
Meter stick with the two masses balanced
g*length*(C2+mass) = g*length*(C3+mass)
(9.8)(.386)(.0212+.1) + (9.8)(.276)(.0195+.15)
.45848N = .45846N
% difference = .0002%
- It is important to add the mass of the clamp into the calculations because they are not small enough to be negligible.

3) C3 + .15 kg at .19 m              C2 + .1 kg at .38 m                   C4 + .2 kg at .769 m
Meter stick balanced with three masses
g*length*(C3+mass) + g*length*(C2+mass) = g*length*(C2+mass)
(9.8)(.296)(.0195+.15) + (9.8)(.106)(.0212+.1) = (9.8)(.283)(.0215+.2)
.4917N + .1259N = .6143N
.6176N = .6143N
% difference = .0033%
4) C3 + .15 kg at .19 m              C2 + .1 kg at .38 m                 C4 + m at .86 m
Meter stick balanced looking for mass of meter stick
g*length*(C3+mass) + g*length*(C2+mass) = g*length*(C4+m)
(9.8)(.296)(.0195+.15) + (9.8)(.106)(.0212+.1) = (9.8)(.374)(.215+m)
.4917 +.1259 = (9.8)(.374)(.0215+m)
.6176 = (3.6652)(.0215+m)
.1685 = .0215+m
.147 = m
% difference = .07%
5) BP at .486 m                          New fulcrum at .78 m       C2 + 200 at .9 m
New fulcrum work and picture
- The clamp holding the meter stick shouldn't be included in the mass because it is holding it balanced not cause more or less mass on it to cause it to change the balance point.

Work and picture for masses at set points
Conclusion: This lab we worked with torque. We were able to find an equilibrium for different scenarios with a meter stick. I learned that there are several ways to add the clamps into the amount of mass on the clamp. Also, I learned that torque is force*lever arm. For us it was simple because there wasn't an angle to deal with. Some of the source of error would be the balance support. The piece supporting the stick wasn't exactly level by itself. Another is that there was a hole drilled into the stick. This changes where the balance point should be. Also, the table and the block of wood that the system was on could not have been balanced. To improve this lab, we would need a better meter stick and to make sure everything was level and working correctly.

Human Power

Purpose: To determine the power output of a person.

Vertical distance between the ground floor and the second floor: 4.29 m
Time 1: 13.47 s
Time 2: 13.31 s   
average time: 13.39 s
F = 618 N

delta PE = mgh
delta PE = 618*4.29
delta PE = 2651.22
Power = 2651.22/13.39
Power = 198 watts

Horse power = 198*.00134102209
Horse power = .2655

Stair diagram


Questions:
1. Is it okay to use your hands and arms on the hand railing to assist you in your climb up the stairs? Explain why or why not.
- It is not okay because it can change the time it takes you to climb the stairs. By changing the time, it changes the power exerted. 

2. Discuss some of the problems with the accuracy of this experiment.
- One problem could be the measurement of the stairs. It could have been off a little. Also, the time. Since the person climbing the stairs wasn't timing themselves, they might not have started walking at the exact time the person started the timer. Along with that, when stopping, the timer may not have stopped exactly when they got to the top of the stairs.

Conclusion questions:
1. Two people of the same mass climb the same flight of stairs. Hinrik climbs the stairs in 25 seconds. Valdis takes 35 seconds. Which person does the most work? Which person expends the most power? Explain your answers.
H: (600)(4.29)/25 = 108.14w(.00134102209) = .145 hp
V: (600)(4.29)/35 = 77.47w(.00134102209) = .104 hp
- Work doesn't depend on time so the work is the same. Hinrik exerts more power because it was a shorter amount of time. Power = work/time

2. A box that weighs 1000 newtons is lifted a distance of 20 meters straight up by a rope and pulley system. The work is done in 10 seconds. What is the power developed in watts and kilowatts?
(1000)(20)/10 = 2000w(1kw/1000w) = 2kw

3. Brynhildur climbs up a ladder to a height of 5 meters. If she is 64 kg:
a) what work does she do?
work = mgh
work = (64)(9.8)(5)
work = 3136J
b) what is the increase in the gravitational potential energy of the person at this height?
- It is depended on the potential energy
c) where does the energy come from to cause this increase in PE?
- Chemical energy

4. Which requires more work: lifting a 50 kg box vertically for distance of 2 m, or lifting a 25 kg box vertically for a distance of 4 meters?
A: work = (50)(9.8)(2) = 980J
B: work = (25)(9.8)(4) = 980J
- The work is the same.

Conclusion: In this lab i learned how much power it takes to climb the stairs. I learned that the amount of time it takes is what controls how much power it is. One problem could be the measurement of the stairs. It could have been off a little. Also, the time. Since the person climbing the stairs wasn't timing themselves, they might not have started walking at the exact time the person started the timer. Along with that, when stopping, the timer may not have stopped exactly when they got to the top of the stairs. To make this lab improved, it would be smart to have each person time themselves.

Tuesday, November 27, 2012

Motion in One Dimension with Air Drag

Purpose: To analyze how changing force affects motion in one dimension.

Introduction Questions:
1) By unit analysis, show that the above equation (Vnew = Vold +aavg*delta(t)) is valid.
m/s = m/s + (m/s^2)*s = m/s

2) Why do we use aavg in equation (1)?
- We assume that acceleration is changing

3) Come up with an analogous equation relating Ynew to Yold.
Ynew = Yold + deltaY

4) What is the benifit of choosing a small delta t?
- For more accuracy

Questions: Fd = -kv (where k is a proportionality constant)

1) Draw a detailed motion diagram of the object falling down.


1a) Now draw a force diagram for the object falling down. Include vectors for all forces, and write a statement of Newton's Second Law. Solve for the acceleration.               Force Diagram
- For every action there is an equal and opposite reaction.
Fnet = Fd - Fg
ma = Fd - Fg
a = (Fd - Fg)/m
a = (-kv - mg)/m
a = (-kv)/m - g

1b) Give the condition for the object at terminal velocity (hit: a = 0). Using the condition solve for k.
0 = (-kv)/m - g
g = -kv/m
mg = -kv
k = -mg/v(terminal)

1c) Substitue k into your expression for the acceleration from part a.
a = -(-gm/v(terminal))v/m - g
a = gv/v(terminal) - g
a = -g(v/v(terminal) +1)

2a) What are the assumptions?
- t = 0 s
- g = 9.8 m/s^2
- v = 100 m/s
- r = 1000 m
- v (terminal) = 40 m/s
- delta t = .1 s

2b) What is v-halfstep?
- Taking the average velocity at two times to find the actual velocity

2c) What is a-halfstep?
- Taking the average acceleration at two times to find the actual acceleration

3) Using the graph paper provided, draw scaled graphs of position vs. time, velocity vs. time, and acceleration vs. time for the object, first assuming no air drag. Make predictions on another sheet of paper about how position and velocity would change if you include air drag.


The position vs. time graph that we predicted is very similar to the actual position vs. time graph. However, the velocity vs. time graph that we predicted is no where near the actual graph. I believe that we accounted for drag wrong and we predicted the graph without drag wrong too.

Now look at a drag force that is dependent on the square of the velocity. Assuming a drag force, Fd = |kv^2|, find the new formula for the acceleration.

Conclusion: This lab was complicated. Even though we did it more as a class, it was still difficult. There could have been a lot of different kinds of error. The fact that most of us didn't really understand it, is cause for a lot of error. I think the only way to do better on this lab is to do it over again.

Friday, October 19, 2012

Centripetal Force

Purpose: To verify Newton's second law of motion for the case of uniform circular motion.

 Table of Trials and Times
The table above shows the five trails for two different masses for the bob. The radius was the same for both masses. To find the time we spun the bob around in a circle 50 times and that gave us our time. The frequency was found by dividing the revolutions (50) buy the time. The time was different for each trial. To find the velocity it is (2pi*50*radius)/time. To find acceleration, it's just velocity/time. To find force we did the (bob mass*velocity^2)/radius.
Once we did that, we found the hanging mass. To find that we hung weight from the bob. The weight was determined by where the weight leveled out the bob to the radius. After found the hanging mass we could find weight, which is just hanging mass*gravity. Then we found the difference between the weight and the force for each trial. As you can tell, for the first bob mass we have under 6% difference for each. Then for the second bob mass, we have under 6.5% difference.

This is the force diagram for the spring. The spring is what the bob is connected to. There are only two forces acting on it. The force of static friction and the force of tension. The forces are equal.


This is the diagram for the hanging weight that held the bob in place at the radius. There are two forces acting on it. The force of tension and the force of gravity. These two forces are equal.


Conclusion: I learned that the hanging weight should be the objective of the force that we found. For sources of error, we could have timed things wrong, measured things wrong, or any other possible human error. To improve we could do more trials and take the best five. When adding mass to the hanging bob, the centripetal force stays the same, but the radius the bob is at changes.

Tuesday, October 9, 2012

Drag Force on a Coffee Filter

Purpose: To study the relationship between air drag forces and the velocity of a falling body.

This is the prediction for the position versus time graph. Before the fall, there is a constant position because it is being held in the same place. Once it falls, the coffee filters decrease in position moving to the floor (origin). The once it hits the floor, it stays in the same place because there is nothing causing it to come back up.


These are all of our trials for the different number of coffee filters. We started with nine filters and did five trials. Then from there we took one filter away after five trials with the same number of filters. We ended with one coffee filter.


This is the position versus time graph. This is the best one out of all of our trials. We found the best fit line and our slope was -2.004. The actual would be -2.


This is the curve from out plotted points. The y-axis is the number of coffee filters, and the x-axis is the absolute values of slope averages of the five trials for each value of filters. With the power fit line, the A = k and the B = n in the drag equation we used. Drag = k|v|^n. For our value of n, we have a 2.289. The actual is supposed to be a 2. Our percent error is 14.45%.


The equation for drag moving through a fluid is:
drag = .5*density*v^2*area*drag coefficient 
This is equation is similar to ours where velocity is squared. However, in the fluid equation are is used not surface area. To compare the drag fluid equation to the normal drag equation (drag = 1/4 * Av^2) you can see many more similarities.  

Conclusion: We learned that air slows down the fall of objects. Also, the less mass there is the more the air acts upon it. Our error could be from not dropping from the exact same height each time. Not dropping it at the same height does affect the experiment. The higher we drop the coffee filter, the longer it takes to reach the ground. If we had dropped the filters from the exact same height each time, then we would have better numbers. Next time, we can make sure we drop the filters at the exact same height and even do more trials to have more data.


Tuesday, September 25, 2012

Working With Spreadsheets

Purpose: To get familiar with electronic spreadsheets by using them in some simple applications.


These are pictures of the first spreadsheet we did. We used f(x)=Asin(Bx+C) as our function. We had x start at zero and then go to 10 by 0.1. In the equation, A = amplitude which is 5 in this equation, B = frequency which is 3, and C = phase which is pi/3.
The first picture has the equation shown. In the second picture, we have the numerical value after excel plugged in the numbers.


This is the graph of the plotted points. The x values are that of which we used in excel sheet. It starts at zero and goes to ten by 0.1. The y values are the numerical values we got after excel plugged the numbers into the equation.
The original equation is f(x)=5sin(3x+(pi/3). After doing the best fit quadratic line, out equation comes out to be f(x)=5sin(3x+1.05). This is fairly correct when pi/3 is rounded to two decimal places. We used 1.047198 for pi/3.


These are the excel spreadsheets from the second equation we did, f(x)=A+Bx+Cx^2. In this equation, A is position (x0) which equals 1000m. B is velocity (v0) which equals 50m/s. Lastly, C is gravity which equals -4.9m/s^2. For the x values, x is represented by delta t which equals 0.2. We interpreted this as the x values start at 0.2 and increase by 0.2 as well. We had it go to ten just like the last equation.
The first spreadsheet shows the equation and the second spreadsheet shows the numerical value after excel plugged the numbers into the equation.


This it the graph that comes from the second equation. The x values are delta t which starts at 0.2 and increase by 0.2. The y values are the numerical values given by plugging the numbers into the equation.
Our original equation was f(x)=1000+50x-4.9x^2. The best fit line we got was f(x)=1000+50x-4.9x^2. The equation is the exact same as the one we used.


Conclusion: This was a good lab to do because we were able to practice or learn how to use excel. It was also good because we could see how the different parts of equations affect the graph. In our group we originally had put acceleration (gravity) as positive 4.9m/s^2. Our graph was completely different from the one that was negative. Our parabola was upside down opening up. That was the only problem we had in this lab. Once we fixed the problem, it all made sense.

Tuesday, September 18, 2012

Vector Addition of Forces

Purpose: To study vector addition by: 1) Graphical means and 2) Using components. A circular force table is used to check results

Our group started with magnitudes 200cm, 100cm, and 150 cm with degrees of 0, 41, and 132 respectively. This is the graph of the vectors given. Thee scale is 1 cm = 20 g.
Vector D is the resultant force. The angle of vector D and the x-axis is 45 degrees.
This graph also shows the x and y components of each vector.


Vector A) Ax = 200g                                       x = 200+100cos(41)+150cos(132) = 175.1g
                Ay = 0g                                            y = 0+100sin(41)+sin(132) = 177.1g
Vector B) Bx = 100cos(41) = 75.5g
                By = 100sin(41) = 65.6g                 R = 250g at 45 degree
Vector C) Cx = 150cos(132) = -100.4g          Rx = 250cos(45) = 176.8g
                Cy = 150sin(132) = 111.5g             Ry = 250sin(45) = 176.8g
 
This graph is solely the x and y components of each vector. The final vector goes from the tail of the first to the head of the last. That vector is the resultant vector.
These pictures are of the circular force table. Our measurements were correct because the first time we put the weights on at the given angles, it was balanced.

This is the picture from the simulation website. using our vectors, we got the same resultant vector.


Conclusion: In this lab we worked with vectors. We found the resultant vector from three vectors given. With this we found that it is balanced with wights and angles that were given. I learned that vectors are basically trig problems. This problem was fairly simple and we didn't have any errors with calculations. We did calculate our vectors two ways, mathematically and with a graphical approach. In our math we got whole numbers but graphically we got numbers that were decimals but could be rounded to the same numbers as ours. Another source of error comes from using the force table. There could have been friction or it could have been unbalanced (in out favor) which would have thrown off the balance. If out calculations were off and the table wasn't balanced but it said it was is why it would be in our favor.

Tuesday, September 11, 2012

Acceleration of Gravity on an Inclined Plane

Procedure: 1) To find the acceleration of gravity by studying the motion of a cart on an incline. 2) To gain further experience using the computer for data collection and analysis.


Ramp 1 1.65 degree
This is the first ramp (not drawn to scale). The length of the long leg is 228.2 cm. To find the height (short leg), we took the height from the ramp on either side and then subtracted them. From there we went to find the angle of elevation. We took arc tan(6.2/228.2) and this came out to theta = 1.56 degrees.
Ramp 2 3.6 degree

This is the second ramp (not drawn to scale). This one had larger angle of elevation. We did the same thing to both sides of the ramp to find the height and it came out to be 14.3 cm. Then we took arc tan(14.3/228.2). Theta = 3.6 degrees.
Graph 1

This is the position verses time graph. It is a parabola because the car went up the ramp and then back down. The car went up the ramp where the velocity was decreasing, and then the car went back down the ramp where the velocity increased.
Graph 2

This is the velocity verses time graph. For this line, there are two different accelerations. This is because there are two different events happening, the car increasing in velocity and the car decreasing in velocity. It is linear because it shows the slope of the parabola from the position verses time graph.


Table 1.56 degree

Trial for 1.56 degree incline a1 (motion up) m/s2 a2 (motion down) m/s2 Gexp m/s2 % difference
1 0.33 0.18 9.4 4.10%
2 0.36 0.18 9.9 1.00%
3 0.34 0.19 9.7 1.00%
This table shows the acceleration for the incline of 1.56 degrees. Both the acceleration for the car moving up and down are on there. By using the equation Gexp=arc sin((a1+a2)/2) we get experimental gravity. Also, we got the percent difference between them and gravity (9.8). For example, Gexp=arc sin((.33+.18)/2)=9.4 for trial one.

Table 3.6 degree

Trial for 3.6 degree incline a1 (motion up) m/s2 a2 (motion down) m/s2 Gexp m/s2 % difference
1 0.69 0.5 9.5 3.30%
2 0.69 0.54 9.8 0.00%
3 0.72 0.52 9.9 1.00%
Conclusion: This table shows the acceleration for the incline of 3.6 degrees. Both the acceleration for the car moving up and down are on there. By using the equation Gexp=arc sin((a1+a2)/2) we get experimental gravity. Also, we got the percent difference between them and gravity (9.8). For trial two, we get a zero percent difference. A source of error would be that we didn't calculate the angle, height, or length of the ramp correctly. We could have done more trials to get even better results.

Tuesday, September 4, 2012

Acceleration of Gravity

Purpose: 1) To determine the acceleration of gravity for a freely falling object. 2) To gain experience using the computer as a data collector.

 We had to throw a ball up over the motion detector to get a position verses time graph. We were supposed to get a parabola for the path of the ball, like we did. The reason it should be a parabola is because the ball will go up and then at some point come down.

Also on this graph is the best fit line. This line shows the closest equation for a parabola. This parabola is a good example because it is almost half of gravity, 9.8 m/s/s, at 4.8 m/s.

This graph is velocity verses time. This graph is a straight line because it takes the slope of the position verses time graph which is linear. The best fit line is also there. This line is a little under what gravity really is. The slope of this line is 9.1 m/s/s.

The slope of this graph is negative because the parabola of the position verses time graph is negative. That is negative because the ball went up and then down. Since the slope of this line is the slope of the parabola the slope has to be negative.


Trial    gexp (2a) (m/s/s)    % difference       gexp (m) (m/s/s)     % difference
1 9.608 1.96 9.13 6.84
2 9.462 3.45 9.259 2.97
3 9.524 2.82 9.416 3.92
4 9.634 1.7 9.613 1.91
5 9.586 2.18 9.74 0.61
This table shows five different ball drops. For each trial we took double the velocity to see how close it is to gravity. The percent difference shows the difference between what we got and what gravity really is. Then we took the slope of acceleration to see how close to gravity it is. The percent difference show the difference between gravity and the slope that we got.

This is the motion diagram we made for position verses time. We labeled the origin and the positive direction. Also, we showed the direction of acceleration. Where the purple arrow is, it shouldn't say a=0, it should say v=0. On the left side it shows that the ball is decreasing in motion in the positive direction. On the right side, the ball is moving in the negative direction and is increasing. The point where there is a break in the motion diagram connected by the pink doted line is where v=0 because there is the point where the ball begins its dissension.


In this lab we found the velocity and acceleration from the path of a ball being tossed in the air. With those we found the difference in what we found and what is actual. Nothing was perfect, because a ball thrown by a person can not be a perfect parabola. That is why we did more than one trial so that we can  get as close to perfect as possible. For all of the velocity, the differences were less than four percent. However, over all the difference for acceleration beat velocity except for one trial. Trials 2-5 were all less than four percent as well. The first trial was less than seven percent. Trial five for acceleration was less than one percent leaving it to be the best over all.

Tuesday, August 28, 2012

Graphical Analysis

Purpose: To gain experience in drawing graphs and in using graphical software.

This is the graph of f(x)=ln(x). We chose to make this a death rate graph where population is by the thousands on the x-axis and the death rate by thousands is on the y-axis.

This is the graph of our ball dropping. The x-axis is time in seconds and the y-axis is position in meters.
In the acceleration due to gravity formula n is the rate at which the object is accelerating.


Question:
We were able to verify this equation: d α gt^n where g=9.8 m/s^2
 d α gt^n = (L) α (L/t^2)(t^n)
L=L/t^2 x t^n
Both sides are then multiplied by t^2 then we will have Lt^2=Lt^n
this shows that n=2

Conclusion: This lab was fun to do, but using the different applications to create the graphs was difficult at times. Eventually my group and I were able to figure it out. Also when we were to draw the graphs ourselves helped me to grasp what exactly each graph represented. Our error comes from not writing down out equation for the graph. This caused us to not have all the information we needed.