This is the graph of f(x)=ln(x). We chose to make this a death rate graph where population is by the thousands on the x-axis and the death rate by thousands is on the y-axis.
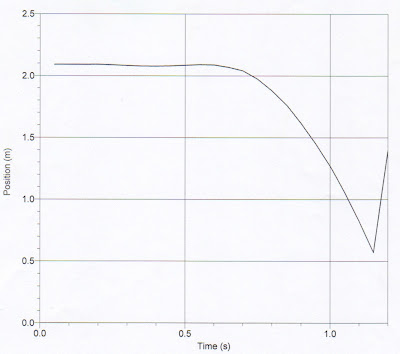
This is the graph of our ball dropping. The x-axis is time in seconds and the y-axis is position in meters.
In the acceleration due to gravity formula n is the rate at which the object is accelerating.
Question:
We were able to verify this equation: d α gt^n where g=9.8 m/s^2
d α gt^n = (L) α (L/t^2)(t^n)
L=L/t^2 x t^n
Both sides are then multiplied by t^2 then we will have Lt^2=Lt^n
this shows that n=2
Conclusion: This lab was fun to do, but using the different applications to create the graphs was difficult at times. Eventually my group and I were able to figure it out. Also when we were to draw the graphs ourselves helped me to grasp what exactly each graph represented. Our error comes from not writing down out equation for the graph. This caused us to not have all the information we needed.

